The chapter contains the industry category, cost factor, economic life estimates, general percent good and level of value factor tables are provided to ensure uniformity in valuing personal property by application of the cost approach. The level of value factor table is provided according to § 39-1-104(12.3)(a)(I), C.R.S., and must be used to factor assessment date actual values of personal property to the level of value (as of the appraisal date) in effect for real property. To aid users with the understanding of how to properly apply these tables to value taxable personal property, the chapter provides explanatory information and language with references, examples, and the following Addenda:
Addendum 4-A, Industry Category Table
Addendum 4-B, Cost Factor Tables
Addendum 4-C, Economic Life Estimates Tables
Addendum 4-D, General Percent Good Tables
Addendum 4-E, Level of Value Factor Table
Addendum 4-F, Consolidated Example
The published tables are subject to verification in the marketplace at the retail “end user” trade level. All cost approach value estimates are based upon the tables found in this chapter. Cost approach value estimates must be reconciled to the market and income approaches to value based upon the appraiser's opinion as to the reliability of the information used to derive the value estimates from each approach. Reconciliation of the applicable approaches to value is required for the valuation of all personal property in Colorado.
The following statute must be considered when determining the actual value of personal property for Colorado ad valorem taxation purposes:
Actual Value Determined When.
(13)(a) [T]he cost approach shall establish the maximum value of property if all costs incurred in the acquisition and installation of such property are fully and completely disclosed by the property owner to the assessing officer.
(c) However, nothing in this subsection (13) shall preclude the assessing officers from considering the market approach or income approach to the appraisal of personal property when such considerations would result in a lower value of the property and when such valuation is based on independent information obtained by the assessing officers.
§ 39-1-103(13), C.R.S.
For Colorado personal property assessment purposes, the actual value is the value in use, as installed. Colorado statutes require that personal property be valued inclusive of all costs incurred in acquisition and installation of the property. The costs of acquisition, installation, sales/use tax, and freight to the point of use must be considered in the personal property valuation. The inclusion of these costs requires that personal property be valued in use. Therefore, the actual value of personal property is based on its value in use.
Counties that develop in-house trending or depreciation tables must submit them annually for approval to the Statutory Advisory Committee to the Property Tax Administrator prior to use.
See Chapter 7, Special Issues, for the Renewable Energy Property information.
Industry Category and Cost Factor Tables
The industry category and cost factor tables are provided to ensure uniformity in the determination of Reproduction Cost New or Replacement Cost New (RCN) estimates by multiplying either original/historical cost or the reasonable cost to the current owner of personal property by the cost price indexes published and made available courtesy of Marshall Valuation Service. When the original/historical cost or the reasonable cost to the current owner is multiplied by the factor for the year of acquisition, the product will approximate the RCN of the personal property being appraised.
The assessor must select the appropriate industry category number that corresponds to the type of personal property being appraised from the industry category table. Fourteen industry category numbers are supplied. In many instances, the individual industry category covers more than one type of commercial or industrial property. Specific types of commercial and industrial property are found in each industry category.
If the property to be factored can be specifically identified, the appropriate specific industry category (such as 3 for office personal property) should be applied. If the property cannot specifically be identified, the industry category for the business type may be used. If property is generally useful in many types of business activities, the predominant use shall determine the industry category.
If particular property types are not included in the table, a comparable property type industry category number may be selected. The “average of all” (industry category number 1) should be selected if the specific property type is not included in any of the industry categories and a similar industry category is not evident.
After selecting the appropriate industry category number, the assessor uses the specific cost factor that corresponds to the year of acquisition of the personal property. The original cost of the personal property is then multiplied by the cost factor to arrive at the estimated RCN as of the assessment date.
Cost Factor Table Example:
| Personal Property | Industry Number | Acquisition Year | Cost | Cost Factor | RCN |
|---|---|---|---|---|---|
| Desk | 3 | 2018 | $1,500 | 1.32 | $1,980 |
In other words, it would cost $1,980 on the current assessment date to reproduce or replace an office desk purchased in 2018 for $1,500.
See Addendum 4-A, Industry Category Table and Addendum 4-B, Cost Factor Tables.
The fixtures/leasehold improvements cost factor table is provided to ensure uniformity in relating original/historical costs or costs to current owner of fixtures or leasehold improvements to the real property level of value. The property may be valued using real property appraisal records for computations and should be assessed to the owner of record.
When using this method of valuation, the property must be classified and abstracted as real property improvements. The factors are useful only in the cost approach when attempting to factor original/historical costs or costs to current owner to the correct level of value. All cost approach value estimates must be reconciled to the sales comparison (market) and income approaches to value as with other real property improvements. The factors found in this table are for estimating RCN only and do not include an allowance for depreciation.
Economic Life Estimates
The economic life estimates are provided to ensure uniformity in applying the general percent good depreciation tables for each type of property being valued. The economic life recommendations are based upon the Class Life Asset Depreciation Range published by the Internal Revenue Service (IRS), Marshall Valuation Service (MVS), and other sources. Additional information about the economic life estimates may be found in IRS publication 946, "How to Depreciate Property", available from the IRS and the MVS cost manuals.
The economic life estimates are based on average national service lives and assume normal use and maintenance of the property. Typical physical depreciation and functional or technological obsolescence for the personal property are accounted for when using the appropriate economic life estimate. Use of economic lives that differ from those in the estimates must be documented. Counties and taxpayers are encouraged to provide this documentation for review by the Division of Property Taxation for possible update of existing published lives.
For specific types of personal property, economic life estimates were developed based on studies completed by the Division of Property Taxation. See Addendum 4-C, Economic Life Estimates Tables.
General Percent Good Tables
The personal property general percent good tables are provided to ensure uniformity in estimating the Reproduction Cost New or Replacement Cost New (RCNLD), whichever is appropriate. The column headings represent the average service life expectancy of the personal property being appraised. Each column contains the percent good factor for a specified age in the life of the property.
Percent good tables measure the value remaining in personal property. Depreciation tables measure the loss in value at a specified age. The factor shown in the columns of the general percent good table represents the percentage of RCN remaining at a specified age. The general percent good tables are built upon the following assumptions:
- Iowa State University property retirement & depreciation studies (Iowa Curve Studies)
- A specified rate of return
- Average condition and usage of typical property
The General Percent Good Table was developed using an estimated probable life (from the Iowa Curve Studies) and a present worth methodology. The probable life is determined using the R-3 Curve from the original Bulletin 125 of the Iowa Curve Studies and revised by Bulletin 155. The right modal curves, including the R-3 curve, are “characterized by few retirements early in life, followed by heavy retirements soon after the average life” (Wolf and Fitch, Depreciation Systems, Iowa State University Press, 1994, page 39). The present worth method is applied using the following formula from Bulletin 155:
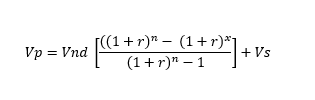
Vp = present value
Vnd = depreciable value new
r = rate
n = probable life
x = age of the property
Vs = net salvage at retirement
This formula is further modified to account for declining net income over the life of the
property.
For further information, see:
Robley Winfrey, Statistical Analysis of Industrial Property Retirements (Bulletin 125), 1935, revised 1967.
Robley Winfrey, Depreciation of Group Properties (Bulletin 155), 1942.
Wolf and Fitch, Depreciation Systems, Iowa State University Press, 1994
The general percent good table is generic in nature. It was designed to be generally useful for the majority of personal property. It is not specific to any particular industry or type of personal property.
The table was designed to account for normal physical depreciation. Typical physical depreciation and functional/technological obsolescence are accounted for when the appropriate economic life estimate is used. Additional functional/technological and/or economic obsolescence may also exist. If documented to exist, additional functional and economic obsolescence must be measured in the marketplace using the direct sales comparison, rent loss, or inutility methods. In addition, any adjustments to the percent good due to the condition of the subject property must be defensible and documented.
The minimum percent good shown for each of the columns is useful as a guide to residual value. It is not absolute and must be reconciled with value in use information at the retail “end user” trade level for similar types of property. If the market information shows that the actual value of personal property is lower than the value developed by using the minimum percent good, the use of the minimum percent good should be rejected in favor of the lower value. The actual value of the personal property must be determined as long as the personal property is taxable.
If the cost-calculated value is lower than the market and/or income approach developed value in use when the personal property reaches its minimum percent good, the assessor should review the original/historical costs or costs to current owner, all assigned factors, the physical condition of the property, and other pertinent contributors to value. If these are correct, the assessor must use the cost approach value as the actual value of the personal property according to § 39-1-103(13)(a), C.R.S.
To use the table, the assessor and other users must determine the economic life and the effective age of the subject property. The percent good may be determined by moving across the columns until the one specified for the economic life is reached and then down this column to the point that reflects the effective age of the property.
The Division has developed percent good tables specifically for technologically advanced personal property and renewable energy personal property. See the Technologically Advanced and Renewable Energy Percent Good Tables section.
General Percent Good Table Example:
| Personal Property | Economic Life | Age | RCN | Percent Good | RCNLD |
|---|---|---|---|---|---|
| Desk | 10 years | 6 years | $1,980 | 50% | $990 |
The RCNLD of the office desk purchased in 2018 for $1,500 is $990.
See Addendum 4-D, General Percent Good Tables.
The assessor and other users must also consider functional and economic obsolescence, atypical physical condition, or other factors that might affect the value of the personal property. They should also consider the frequency and extent of maintenance to the property. Extensive maintenance or reconditioning of the property may extend the economic life of the property just as a lack of maintenance may shorten the economic life.
Depreciated Value Floor
In the year in which the personal property has reached its minimum residual percent good floor, the applicable RCN trending factor in use at that time is "frozen" and the Level of Value (LOV) adjustment factor is “frozen” at 1.0. For the assessment years that follow, the RCNLD value does not change unless the personal property has been reconditioned or upgraded to extend its remaining economic life.
It is possible that the market or income approach may indicate a lower value than the personal property’s minimum percent good. In addition, as property ages, the use of original installed cost multiplied by trending factors may not yield reasonable RCN values. Any RCNLD estimate should be crosschecked with sales comparison (market) and income information sources, if possible, and the appropriate value used.
Valuation of Used Personal Property
The valuation of used personal property requires that a decision be made concerning the remaining economic life of the property. If the personal property's elapsed age from its actual year of manufacture, or estimated effective year of manufacture, is equal to or greater than the number of years in which the personal property would have reached its fully depreciated value floor, then the price paid for the personal property is to be treated as RCNLD and "frozen" at that value. RCN trending and percent good factors will not be applied to the frozen value. The LOV adjustment factor is “frozen” at 1.0 and will remain 1.0 unless the personal property is reconditioned or upgraded.
When the personal property is reconditioned to extend its remaining economic life and/or upgraded to improve its utility, the reconditioned/upgraded personal property may be treated similar to newer personal property and the acquisition cost subject to depreciation over a complete economic life of the personal property. In such cases, the county staff should contact the taxpayer and discuss the effect that the reconditioning/upgrade has had on the personal property so that a reasonable effective age for the personal property may be established.
Even though personal property has been permanently taken out of service, but has not been scrapped or sold, it still has value. However, additional functional and/or economic obsolescence may exist.
If the elapsed age from the year of manufacture, or estimated effective year of manufacture, is less than the number of years when the personal property would have reached its depreciated value floor, as evidenced in its recommended economic life from Addendum 4-C, then the property is treated similar to new personal property and the owner's acquisition cost is subject to depreciation over the personal property’s complete economic life. However, the resulting value should be compared to the sales comparison (market) value for the personal property, if possible.
Technologically Advanced and Renewable Energy Percent Good Tables
Using market studies, two separate technologically advanced percent good tables have been developed for Personal Computers (PCs) and Accessories and for Other Computers and Stand Alone Peripherals. These percent good tables account for typical physical depreciation as well as functional and technological obsolescence intrinsic to technologically advanced or “high tech” property.
We have assigned Personal Computers and Accessories to Industry Category (RCN Factor) Table 13 (no RCN trending) and to a three (3) year economic life. The percent good table for Personal Computers (PCs) and Accessories utilizes an accelerated depreciation schedule with a seven percent (7%) residual value.
We have assigned Other Computers and Stand Alone Peripherals to Industry Category (RCN Factor) Table 13 (no RCN trending) and to a four (4) year economic life. The percent good table for Other Computers and Stand Alone Peripherals utilizes an accelerated depreciation schedule with a seven percent (7%) residual value.
The Other Computers and Stand Alone Peripherals percent good table should also be used for copiers and telecommunication personal property.
For personal property classified as computer-integrated personal property, a four (4) year economic life is assigned. The four (4) year life depreciation table found in the General Percent Good Table in this chapter should be used and not the Other Computers and Stand Alone Peripherals percent good table.
If you have questions concerning personal computers (PCs) and accessories, other computers and stand-alone peripherals, computer-integrated personal property, copiers, or telecommunication personal property, please refer to Chapter 7, Special Issues, under Technologically Advanced Personal Property.
The Renewable Energy Percent Good Table should be used for renewable energy personal property valued in accordance with §§ 39-5-104.7(1)(a) and 39-4-102(1)(e), C.R.S. This table utilizes a twenty-year economic life with straight-line depreciation and a twenty percent (20%) depreciated floor value. For more information the assessment of renewable energy personal property, please refer to Chapter 7, Special Issues, under Renewable Energy Property Assessment.
Level of Value Factors
The following table contains the indexes for adjusting current actual value of personal property to the level of value (LOV) in effect for real property as specified by § 39-1-104(12.3)(a)(I), C.R.S. The procedure involves the multiplication of the assessment date actual value (RCNLD) estimate by the appropriate LOV factor for the type of property being valued. When personal property reaches its fully depreciated value floor the actual value should be determined and frozen. The LOV factor is "frozen" at 1.0 and will remain 1.0 unless the personal property is reconditioned or upgraded.
Level of Value Factor Example:
| Personal Property | Industry Number | Age | RCNLD | LOV Factor | Actual Value |
|---|---|---|---|---|---|
| Desk | 3 | 6 years | $990 | 0.95 | $940 |
The RCNLD rolled back to the 6/30/22 appraisal date for the office desk purchased in 2018 for $1,500 is $940.
See Addendum 4-E, Level of Value Factor Table and Addendum 4-F, Consolidated Examples.
Addendum 4-A, Industry Category Table
Types of Personal Property Included in Industry Categories:
Industry Category Table
| Industry Category Number | Property Type |
|---|---|
| 1 | Average of All |
| 2 | Candy and Confectionery, Creamery and Dairy, Flour, Cereal and Feed, Garage, Meat Packing, Paint, Refrigeration and Rubber |
| 3 | Office Personal Property (excluding copiers and other technologically advanced personal property) |
| 4 | Retail and Wholesale Stores, Warehousing |
| 5 | Rental Furnishings, Apartments, Hotels and Motels |
| 6 | Banks, Savings and Loans, Restaurants and Lounges, and Theaters |
| 7 | Contractors’ Personal Property |
| 8 | Laundry & Cleaning Personal Property |
| 9 | Industrial Bakery, Bottling, Canneries, and Fruit Packing |
| 10 | Brewing and Distilling, Cement, Clay Products, Glass, Metal, Logging, Metal Working, Mining and Milling |
| 11 | Manufacturing of Chemical, Electrical, Paper, Motion Pictures and Television, Printing, and Woodworking Personal Property |
| 12 | All Petroleum, Oil, Gas, Ethanol, Bio-diesel, and Textile |
| 13* | Computer and PC, Computer-integrated Personal Property, Telephone and Telecommunication Personal Property, and Copiers |
| 14† | Renewable Energy Personal Property |
Source: Marshall Valuation Service
* Please refer to Chapter 7, Special Issues, under Technologically Advanced Personal Property, for more information.
† Please refer to Chapter 7, Special Issues, under Renewable Energy Property Assessment, for more information.
Addendum 4-B, Cost Factor Tables
2024 Personal Property Cost Factor Table
| Year Acquired | Industry Category Number | |||||||||||||
|---|---|---|---|---|---|---|---|---|---|---|---|---|---|---|
| 1 | 2 | 3 | 4 | 5 | 6 | 7 | 8 | 9 | 10 | 11 | 12 | 13 | 14 | |
| 1998 | 2.09 | 2.01 | 1.93 | 2.07 | 2.01 | 2.00 | 2.03 | 2.14 | 2.18 | 2.27 | 2.14 | 2.20 | 1.00 | 1.00 |
| 1999 | 2.09 | 2.01 | 1.93 | 2.07 | 2.00 | 1.99 | 2.02 | 2.14 | 2.18 | 2.26 | 2.15 | 2.19 | 1.00 | 1.00 |
| 2000 | 2.05 | 1.97 | 1.90 | 2.03 | 1.96 | 1.96 | 1.98 | 2.10 | 2.14 | 2.22 | 2.11 | 2.16 | 1.00 | 1.00 |
| 2001 | 2.04 | 1.96 | 1.88 | 2.02 | 1.95 | 1.95 | 1.97 | 2.08 | 2.12 | 2.20 | 2.10 | 2.13 | 1.00 | 1.00 |
| 2002 | 2.02 | 1.94 | 1.87 | 2.00 | 1.93 | 1.94 | 1.96 | 2.07 | 2.11 | 2.19 | 2.10 | 2.11 | 1.00 | 1.00 |
| 2003 | 1.99 | 1.92 | 1.85 | 1.97 | 1.91 | 1.91 | 1.93 | 2.03 | 2.07 | 2.14 | 2.06 | 2.07 | 1.00 | 1.00 |
| 2004 | 1.93 | 1.86 | 1.80 | 1.91 | 1.86 | 1.85 | 1.87 | 1.96 | 2.00 | 2.06 | 1.98 | 2.00 | 1.00 | 1.00 |
| 2005 | 1.79 | 1.74 | 1.71 | 1.78 | 1.76 | 1.74 | 1.75 | 1.82 | 1.84 | 1.90 | 1.82 | 1.84 | 1.00 | 1.00 |
| 2006 | 1.71 | 1.66 | 1.64 | 1.72 | 1.69 | 1.67 | 1.68 | 1.74 | 1.75 | 1.81 | 1.71 | 1.74 | 1.00 | 1.00 |
| 2007 | 1.63 | 1.58 | 1.57 | 1.65 | 1.63 | 1.61 | 1.62 | 1.65 | 1.65 | 1.72 | 1.60 | 1.63 | 1.00 | 1.00 |
| 2008 | 1.57 | 1.53 | 1.53 | 1.60 | 1.59 | 1.56 | 1.57 | 1.59 | 1.58 | 1.64 | 1.53 | 1.56 | 1.00 | 1.00 |
| 2009 | 1.52 | 1.49 | 1.48 | 1.55 | 1.55 | 1.52 | 1.52 | 1.53 | 1.54 | 1.57 | 1.50 | 1.49 | 1.00 | 1.00 |
| 2010 | 1.54 | 1.50 | 1.49 | 1.56 | 1.54 | 1.53 | 1.53 | 1.55 | 1.56 | 1.59 | 1.52 | 1.52 | 1.00 | 1.00 |
| 2011 | 1.49 | 1.45 | 1.45 | 1.52 | 1.50 | 1.49 | 1.49 | 1.50 | 1.51 | 1.55 | 1.45 | 1.48 | 1.00 | 1.00 |
| 2012 | 1.45 | 1.42 | 1.42 | 1.48 | 1.46 | 1.45 | 1.44 | 1.46 | 1.47 | 1.50 | 1.41 | 1.44 | 1.00 | 1.00 |
| 2013 | 1.44 | 1.41 | 1.41 | 1.46 | 1.44 | 1.44 | 1.41 | 1.45 | 1.46 | 1.48 | 1.42 | 1.43 | 1.00 | 1.00 |
| 2014 | 1.42 | 1.39 | 1.40 | 1.44 | 1.42 | 1.42 | 1.39 | 1.43 | 1.44 | 1.47 | 1.42 | 1.41 | 1.00 | 1.00 |
| 2015 | 1.41 | 1.38 | 1.38 | 1.42 | 1.40 | 1.40 | 1.38 | 1.42 | 1.43 | 1.45 | 1.42 | 1.40 | 1.00 | 1.00 |
| 2016 | 1.42 | 1.40 | 1.38 | 1.43 | 1.40 | 1.41 | 1.38 | 1.43 | 1.45 | 1.46 | 1.45 | 1.42 | 1.00 | 1.00 |
| 2017 | 1.39 | 1.37 | 1.36 | 1.40 | 1.37 | 1.38 | 1.36 | 1.40 | 1.42 | 1.44 | 1.42 | 1.40 | 1.00 | 1.00 |
| 2018 | 1.35 | 1.33 | 1.32 | 1.35 | 1.33 | 1.33 | 1.33 | 1.35 | 1.38 | 1.40 | 1.36 | 1.37 | 1.00 | 1.00 |
| 2019 | 1.30 | 1.29 | 1.28 | 1.30 | 1.29 | 1.29 | 1.28 | 1.30 | 1.32 | 1.34 | 1.32 | 1.31 | 1.00 | 1.00 |
| 2020 | 1.30 | 1.28 | 1.26 | 1.30 | 1.27 | 1.28 | 1.27 | 1.30 | 1.32 | 1.33 | 1.33 | 1.31 | 1.00 | 1.00 |
| 2021 | 1.19 | 1.18 | 1.18 | 1.18 | 1.18 | 1.18 | 1.19 | 1.20 | 1.20 | 1.22 | 1.20 | 1.21 | 1.00 | 1.00 |
| 2022 | 1.02 | 1.02 | 1.03 | 1.01 | 1.03 | 1.01 | 1.04 | 1.01 | 1.02 | 1.03 | 0.99 | 1.03 | 1.00 | 1.00 |
| 2023 | 1.00 | 1.00 | 1.00 | 1.00 | 1.00 | 1.00 | 1.00 | 1.00 | 1.00 | 1.00 | 1.00 | 1.00 | 1.00 | 1.00 |
Source: Marshall Valuation Service, October 2023
2024 Fixtures/Leasehold Improvements Cost Factor Table
| Year Acquired | Factor |
|---|---|
| 1998 | 2.56 |
| 1999 | 2.49 |
| 2000 | 2.36 |
| 2001 | 2.34 |
| 2002 | 2.29 |
| 2003 | 2.24 |
| 2004 | 2.08 |
| 2005 | 1.96 |
| 2006 | 1.85 |
| 2007 | 1.77 |
| 2008 | 1.73 |
| 2009 | 1.72 |
| 2010 | 1.72 |
| 2011 | 1.66 |
| 2012 | 1.62 |
| 2013 | 1.54 |
| 2014 | 1.50 |
| 2015 | 1.47 |
| 2016 | 1.47 |
| 2017 | 1.44 |
| 2018 | 1.38 |
| 2019 | 1.35 |
| 2020 | 1.33 |
| 2021 | 1.18 |
| 2022 | 1.02 |
| 2023 | 1.00 |
Source: Marshall Valuation Service, October 2022
Addendum 4-C, Economic Life Estimates
Addendum 4-C, Economic Life Estimates
Addendum 4-D, General Percent Good Tables
2024 General Percent Good Table
| Effective Age | Average Economic Life in Years | |||||||||||||||||
|---|---|---|---|---|---|---|---|---|---|---|---|---|---|---|---|---|---|---|
| 3 | 4 | 5 | 6 | 7 | 8 | 9 | 10 | 11 | 12 | 13 | 14 | 15 | 16 | 17 | 18 | 19 | 20 | |
| 1 | 67 | 76 | 81 | 85 | 88 | 89 | 91 | 92 | 93 | 94 | 95 | 95 | 96 | 96 | 96 | 97 | 97 | 97 |
| 2 | 38 | 53 | 63 | 70 | 75 | 79 | 82 | 84 | 86 | 88 | 89 | 90 | 91 | 92 | 93 | 93 | 94 | 95 |
| 3 | 17 | 33 | 45 | 55 | 62 | 68 | 72 | 76 | 79 | 81 | 83 | 85 | 86 | 88 | 89 | 90 | 91 | 92 |
| 4 | 15 | 17 | 30 | 41 | 49 | 57 | 62 | 67 | 71 | 74 | 77 | 79 | 81 | 83 | 85 | 86 | 87 | 88 |
| 5 | 15 | 18 | 29 | 38 | 47 | 53 | 59 | 63 | 67 | 71 | 74 | 76 | 79 | 81 | 82 | 84 | 85 | |
| 6 | 15 | 19 | 28 | 36 | 43 | 50 | 56 | 60 | 64 | 68 | 71 | 74 | 76 | 78 | 80 | 82 | ||
| 7 | 15 | 19 | 28 | 36 | 42 | 48 | 54 | 58 | 62 | 66 | 69 | 72 | 74 | 76 | 78 | |||
| 8 | 15 | 20 | 28 | 34 | 41 | 46 | 51 | 57 | 60 | 64 | 67 | 70 | 72 | 75 | ||||
| 9 | 15 | 21 | 27 | 33 | 40 | 46 | 50 | 55 | 59 | 62 | 65 | 69 | 71 | |||||
| 10 | 15 | 21 | 27 | 34 | 39 | 44 | 49 | 54 | 57 | 61 | 64 | 67 | ||||||
| 11 | 17 | 22 | 27 | 34 | 39 | 44 | 49 | 52 | 56 | 60 | 63 | |||||||
| 12 | 15 | 18 | 23 | 27 | 33 | 39 | 43 | 47 | 52 | 56 | 59 | |||||||
| 13 | 15 | 19 | 23 | 30 | 33 | 38 | 42 | 47 | 52 | 55 | ||||||||
| 14 | 15 | 21 | 24 | 30 | 35 | 38 | 44 | 48 | 51 | |||||||||
| 15 | 16 | 19 | 25 | 30 | 35 | 39 | 43 | 47 | ||||||||||
| 16 | 15 | 17 | 20 | 26 | 31 | 35 | 39 | 43 | ||||||||||
| 17 | 15 | 19 | 21 | 26 | 31 | 35 | 39 | |||||||||||
| 18 | 15 | 21 | 22 | 27 | 31 | 35 | ||||||||||||
| 19 | 17 | 19 | 23 | 28 | 32 | |||||||||||||
| 20 | 15 | 15 | 20 | 24 | 28 | |||||||||||||
| 21 | 17 | 21 | 25 | |||||||||||||||
| 22 | 15 | 18 | 23 | |||||||||||||||
| 23 | 16 | 20 | ||||||||||||||||
| 24 | 15 | 18 | ||||||||||||||||
| 25 | 15 | |||||||||||||||||
| 26 | ||||||||||||||||||
Source: Division of Property Taxation Rate Applied: 8.0%
2024 Technologically Advanced Percent Good Tables
Using market studies, the following table has been developed for Personal Computers (PCs) and Accessories:
Three-Year Economic Life Table
| Effective Age | Percent Good |
|---|---|
| 1 | 44% |
| 2 | 23% |
| 3 | 13% |
| 4 | 7% |
Source: Division of Property Taxation
Using market studies, the following table has been developed for Other Computers and Stand Alone Peripherals:
Four-Year Economic Life Table
| Effective Age | Percent Good |
|---|---|
| 1 | 50% |
| 2 | 36% |
| 3 | 22% |
| 4 | 13% |
| 5 | 7% |
Source: Division of Property Taxation
2024 Renewable Energy Percent Good Table
The following table has been developed for locally assessed renewable energy personal property valued in accordance with §§ 39-5-104.7(1)(a) and 39-4-102(1)(e), C.R.S.:
| Effective Age | Percent Good |
|---|---|
| 1 | 95% |
| 2 | 90% |
| 3 | 85% |
| 4 | 80% |
| 5 | 75% |
| 6 | 70% |
| 7 | 65% |
| 8 | 60% |
| 9 | 55% |
| 10 | 50% |
| 11 | 45% |
| 12 | 40% |
| 13 | 35% |
| 14 | 30% |
| 15 | 25% |
| 16 | 20% |
| 17 | 20% |
| 18 | 20% |
| 19 | 20% |
| 20 | 20% |
For more information on the assessment of renewable energy personal property, please refer to Chapter 7, Special Issues, Renewable Energy Property Assessment.
Addendum 4-E, Level of Value Factors
2024 Personal Property LOV Factor Table
June 30, 2022 Level of Value
| Industry Category Number | LOV Factor |
|---|---|
| 1 | 0.96 |
| 2 | 0.96 |
| 3 | 0.95 |
| 4 | 0.97 |
| 5 | 0.95 |
| 6 | 0.97 |
| 7 | 0.94 |
| 8 | 0.96 |
| 9 | 0.96 |
| 10 | 0.95 |
| 11 | 0.98 |
| 12 | 0.95 |
| 13 | 1.00 |
| 14 | 1.00 |
| Fixtures & Leasehold Imps | 0.95 |
Source: Division of Property Taxation and Marshall Valuation Service
Addendum 4-F, Consolidated Example
Cost Factor Table Example:
| Personal Property | Industry Number | Acquisition Year | Cost | Cost Factor | RCN |
|---|---|---|---|---|---|
| Desk | 3 | 2018 | $1,500 | 1.32 | $1,980 |
In other words, it would cost $1,980 on the current assessment date to reproduce or replace an office desk purchased in 2018 for $1,500.
General Percent Good Table Example:
| Personal Property | Economic Life | Age | RCN | Percent Good | RCNLD |
|---|---|---|---|---|---|
| Desk | 10 years | 6 years | $1,980 | 50% | $990 |
The RCNLD of the office desk purchased in 2018 for $1,500 is $990.
Level of Value Factor Example:
| Personal Property | Industry Number | Age | RCNLD | LOV Factor | Actual Value |
|---|---|---|---|---|---|
| Desk | 3 | 6 years | $990 | 0.95 | $940 |
The RCNLD rolled back to the 6/30/22 appraisal date for the office desk purchased in 2018 for $1,500 is $940.